Carpal tunnel syndrome: correlation of the severity of the clinical picture and electrophysiological studies
Article information

Abstract
Purpose
This study aimed to correlate the severity of carpal tunnel syndrome (CTS) in terms of the clinical picture with electrophysiological studies to determine whether the severity could be predicted through one measure based on correlations with another.
Methods
This cross-sectional correlational study enrolled 96 patients (139 hands) whose nerve conduction studies (NCS) confirmed the diagnosis of CTS, and to whom the Boston Carpal Tunnel Questionnaire (BCTQ) was administered to determine the subjective and clinical CTS severity. The severity of both measures was correlated.
Results
The patients’ mean age was 49.84±12.23 years. Most (67.7%) were female. The NCS severity grades were as follows: mild, 46%; moderate, 32.4; severe, 9.4%; and very severe, 12.2%. The sensory and motor NCS parameters were significantly correlated with the BCTQ severity. The patients’ overall mean scores for symptom severity had substantive predictive accuracy for the patients’ CTS severity measured with the NCS. Similarly, most of the functional severity score items had significant predictive accuracy for the patients’ NCS-based carpal tunnel severity score.
Conclusion
The clinical severity of CTS was strongly correlated with the severity based on nerve conduction. This correlation was more notable for symptom severity scores than for functional status scores. Night pain and numbness demonstrated the strongest associations of all BCTQ items with the NCS. Although clinical severity (based on the BCTQ) predicts the nerve conduction severity, we still recommend performing NCS for patients with a clinical diagnosis of CTS as a confirmatory objective measure and for medico-legal reasons.
Introduction
Carpal tunnel syndrome (CTS) is a common health problem that results from median nerve entrapment within the carpal tunnel [1]. It is considered the most common compressive neuropathy in the body and affects 5% of the general population [2]. Nerve compression influences nerve conductivity, which consequently leads to diminishing or loss of nerve function, and is manifested by paresthesia and pain at median nerve distribution [3,4].
CTS diagnosis is based on the clinical picture, where electrophysiological studies are confirmatory ones. Additionally, it helps assess the severity of nerve compression, which consequently guides the treatment [5]. Nerve conduction studies (NCS) comprise nerve conduction velocity (NCV) studies and electromyography (EMG) studies. NCV measures the speed at which electrical signals propagate along peripheral nerves; this is done for both motor and sensory nerves. EMG is used in diagnosis once NCV is debatable. Based on NCS, CTS severity can be graded into the following classes: mild, moderate, severe, and very severe compression [6,7].
Patients used to describe their symptoms subjectively in the same manner, describing them as mild to very severe symptoms. In order to avoid the subjective variations between patients and possible exaggeration, there are many measures to make the nonobjective complaining more reliable and reproducible. Levine et al. invented the Boston Carpal Tunnel Questionnaire (BCTQ), which is specific for CTS to measure the severity of symptoms and the affection of function [8].
This study’s primary goal is to correlate CTS’s severity in the clinical picture (BCTQ) and electrophysiological studies (NCS) to deduce both measures’ relationship. Based on the study, the severity of NCS according to patients’ complaints is foreseen. Thus, we may accept the clinical presentation for treatment options decision without doing electrophysiological studies.
Methods
Ethics statement: This study was approved by the Human Research Ethics Committee of Royal Medical Services (No. 1/2021) on April 10, 2021. Verbal consent for the study was obtained from the patients at the clinic.
1. Patients and setting
This cross-sectional correlational study was conducted at Royal Medical Services between May and November 2021. All patients who attended the orthopedic clinic at Prince Rashid Bin Al-Hasan Military Hospital with NCS results confirming CTS diagnosis were asked to fill the BCTQ.
A total of 96 patients (139 hands) were enrolled in this study. Patients with bilateral CTS were analyzed for each hand separately. Exclusion criteria were patients with ipsilateral compressive neuropathy of ulnar or radial nerves, more proximal involvement of median nerve, and ipsilateral cervical radiculopathy.
2. Electrodiagnostic test
After adjusting the skin temperature to at least 33°C, median nerve motor and sensory amplitudes, velocities and latencies were recorded. The motor responses were recorded over the abductor pollicis brevis muscle by orthodromic stimulation at wrist level, 7 cm proximal to the recording electrodes. For median sensory response, antidromic stimulation at the wrist with a middle finger recording electrode was applied. The following sensory and motor nerve conduction parameters were obtained: sensory velocity (SV), sensory nerve action potential, motor distal latency (MDL), and compound motor action potential.
According to NCS findings, the severity of nerve compression is classified into four categories: (a) mild, abnormal sensory study (SV of <40 m/sec) with normal motor study (MDL of <4.5 ms); (b) moderate, abnormal sensory study (SV of <40 m/sec) and abnormal motor study (MDL of 4.5–6.5 ms); (c) severe, absent sensory recording and delayed motor response (MDL of 4.5–6.5 ms); (d) very severe, absent sensory response and delayed motor response (MDL of >6.5 ms) [9].
3. Clinical severity grading
We used Arabic-translated BCTQ in this study. Arabic version of BCTQ was evaluated in many studies and was found to be a reliable, valid, feasible, and reproducible test and is recommended for Arabic-speaking patients with CTS [9,10]. BCTQ comprises two elements; an 11-items symptom severity scale and an 8-items functional status scale. Each item is graded according to severity from 1 to 5, where 1 represents no symptom nor disability and 5 represents extreme symptoms or functional disability. Zero point was given for any items in case of failure to answer secondary to being uncertain or being irrelevant. Symptom severity score (SSS) and functional status score (FSS) were calculated for each patient by taking the average of all corresponding scale items. For patients with bilateral CTS, we applied BCTQ twice for each hand separately.
Based on the BCTQ score, patients were divided into five categories according to severity: (1) minimal or negative, 0–1 point; (2) mild, 1.1–2 points; (3) moderate, 2.1–3 points; (4) severe, 3.1–4 points; and (5) very severe, 4.1–5 points [11].
4. Statistical analysis
The mean and the standard deviation (SD) were used to describe the continuously measured variables and the frequencies and percentages for the categorically measured variables. The Kolmogorov-Smirnov statistical test of normality and the histograms were used to assess the statistical normality assumption and the Levene statistical test for the equal variance statistical assumption. The Pearson (r) correlation test was used to assess the association between the CTS-diagnosed patient’s severity of illness classification measured with NCS by physicians at the admission time with the patient’s admission time subjective measures of disease symptoms and dysfunctions (BCTQ).
The independent samples t-test and the one-way analysis of variance were applied to assess the statistical significance of mean NCS-based severity across the levels of categorically measured patients’ sociodemographic and nerve conduction characteristics. The area under the receiver operating curve (AUR ROC) test was applied to assess the overall predictive accuracy of the patients’ observed subjective indicators of CTS severity and dysfunction. When assessing the NCS-based severity, a cutoff value for the AUR ROC of 0.70 was considered substantive predictive accuracy.
Because some of the patients were measured twice (two extremities), the multivariate generalized linear mixed analysis was used to assess the combined and individual association between patients’ subjective measured severity of CTS with their nerve conduction-based severity. Accounting for patients’ age, sex, and affected side as covariates in the analysis, this latter analysis allowed the analysis model to account for the dependency between patients and their measured extremities via adding the patients’ ID as a random factor in the analysis model. The association between predictor independent variables with the NCS-based severity was expressed as a β coefficient with a 95% confidence interval.
The IBM SPSS Statistics ver. 22 (IBM Corp., Armonk, NY, USA) was used for the statistical data analysis; the alpha significance level was considered at 0.050.
Results
1. Demographics results
One hundred thirty-nine CTS-diagnosed hands of 96 patients were enrolled electively in the study. Table 1 displays the descriptive analysis findings of the patients’ sociodemographic characteristics and disease. The analysis findings showed that most of the patients (67.7%) were female and the remaining patients were male (32.3%).
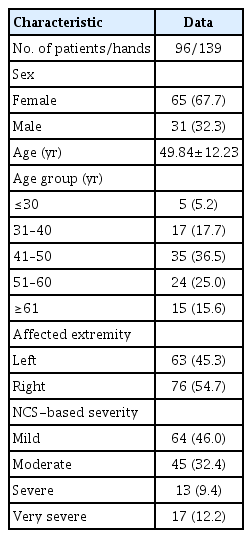
Descriptive analysis of the CTS patients’ sociodemographic characteristics
The mean age for the sample of patients was equal to 49.84 years (SD, 12.23 years). However, when considering their categorized age groups, most patients were between 41 and 60 years old. The right hand was affected in 54.7%, and most patients had mild severity CTS according to NCS.
2. Nerve conduction studies results
Table 2 displays the bivariate analysis of the patients’ mean NCS-based severity scores and statistical correlations with their sociodemographic and disease-related findings. An independent samples t-test showed that male and female CTS-diagnosed patients and patients’ age groups did not differ significantly in their mean NCS-based severity of disease score (t[137]=0.50, p=0.630; f [4.134]=2.10, p=0.091, consequently). Moreover, the NCS-based severity did not differ between the patient’s left and right extremities (t[137]=0.22, p=0.829).
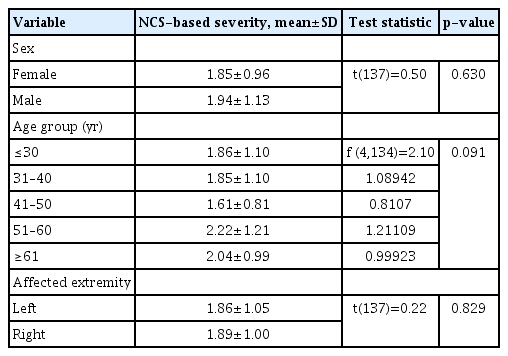
Bivariate analysis of the patients’ mean NCS-based severity of carpal tunnel syndrome at the time of presentation
3. The results of Boston Carpal Tunnel Questionnaire
Table 3 displays the descriptive analysis of the patients’ perceptions of their CTS symptoms and dysfunction as measured with the BCTQ. The findings showed that the top four perceived CTS symptoms were as follows: nightly hand numbness and tingling that wakens the patients, followed by severe hand and wrist pains at night, then hand and wrist pain during the daytime, and having hand numbness as well as severe nightly hand numbness. However, the patients’ least perceived symptoms of the CTS were hand weakness, difficulty grasping small objects, and typically daytime hand and wrist pains.
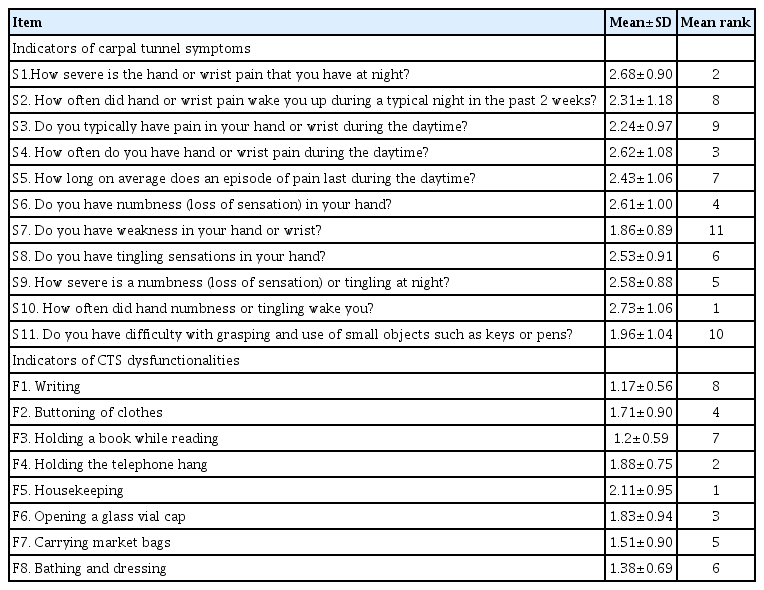
Descriptive analysis of the patients’ subjective evaluation of their CTS symptoms using the BCTQ
Regarding the patients’ perception of their CTS-associated dysfunctions, the analysis findings showed that the patients’ top perceived dysfunctions were difficulty doing housekeeping followed by difficulty handling the telephone handset, difficulty opening a glass jar, and difficulty buttoning clothes. However, the lowest difficulty rating assigned by the patients was given to writing and holding a book while reading then bathing and self-dressing. In Table 3, particularly the fourth column is displaying the mean rank of those difficulties sorted in ascending order.
4. Analytical results
For a better understanding of how the NCS and the patient’s subjective measures of CTS symptoms severity and dysfunctions converge on severity classification based on the NCS, the Pearson (r) correlation test was used to assess the bivariate associations between these metric measures of the patient symptoms and severity with the interim severity classification of NCS scores (Table 4). The findings showed that the patients’ subjective BCTQ SSS was statistically significant and positively correlated with their NCS-based severity classification (r=0.634, p<0.010), denoting that as the patients’ self-rated symptom score tended to rise; their corresponding NCS-based severity score tended to rise incrementally, too.
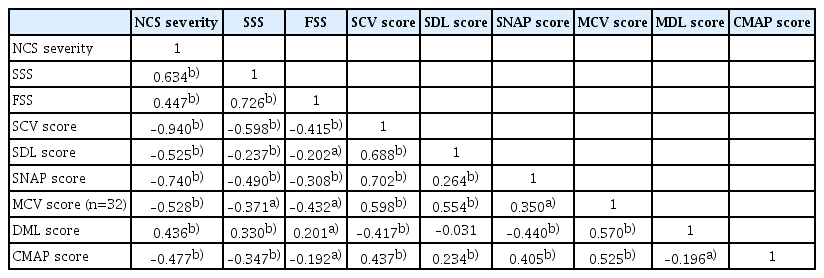
Bivariate Pearson (r) correlations between patients’ measured CTS disease severity indicators based on NCS and subjective evaluation
Furthermore, the patients’ subjective BCTQ FSS correlated significantly and positively with their NCS-based severity classification score (r=0.447, p<0.010), as the patients’ self-rated dysfunction mean score tended to rise; their corresponding NCS-based severity mean score tended to rise incrementally, too.
To clarify how the indicators of the CTS symptoms and dysfunction measured with the BCTQ had converged on the NCS-based severity classification, the Pearson bivariate test of correlation was applied between these indicators and the patient's NCS-based severity score (Table 5). Additionally, the AUR ROC nonparametric test was utilized to assess each BCTQ indicator’s predictive accuracy for the patients’ NCS dichotomized severity when coded as follows: 0, moderate or below vs. 1, severe to very severe.
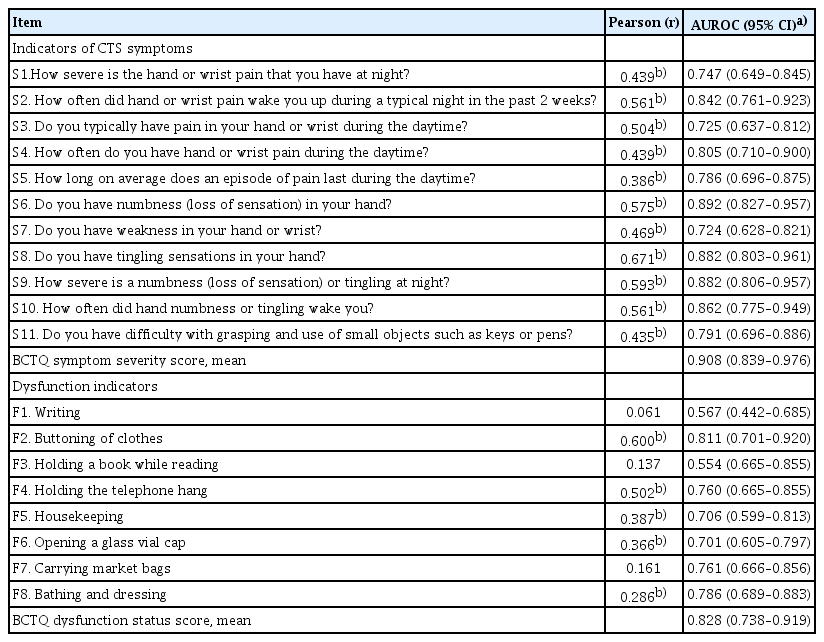
Bivariate Pearson (r) correlations and AUR ROC between the patients’ perceived indicators of the BCTQ with the NCS-based severity of illness
To unravel the findings, the analysis with the Pearson correlation test suggested that all the patients’ self-rated indicators of CTS symptom severity had correlated significantly and positively (r>0.390) using the Pearson (r) test indicating that; moderate to strong correlations exist between those subjective measured indicators of CTS symptoms with the nerve conduction-based severity score provided by the electrophysiological measures. However, the AUR ROC analysis showed also that all those indicators had great predictive accuracy (r>0.72) explaining the patients’ severe CTS states. Nonetheless, it was found that the symptom items (#6, #8, #9, #10, #2, and #4) had a substantial predictive accuracy for the patients’ severe CTS state measured with NCS. Even so, by considering the content of these indicators, it becomes clear that they had measured the extent of nightly and daytime hand numbness and pain associated with the CTS disease. The patients’ overall SSS had a substantive predictive accuracy for the patients’ CTS severe states measured with the NCS (AUR ROC, 0.91%).
By considering the patients rated indicators of CTS dysfunction, it was found that only dysfunctionality items (#2, buttoning of clothes; #4, gripping the telephone handle; #5, housekeeping; #6, opening a glass vial cap; and #8, bathing and dressing) had a statistically significant bivariate correlation with the patient’s NCS-based severity score, but the other dysfunctionality indicators of holding a book, writing, and carrying market bags had not correlated significantly with the patients mean NCS-based severity.
The AUR ROC analysis also was congruent with the Pearson correlation test findings; most of the items had a significant predictive accuracy (AUR ROC, >0.74) of the patient’s NCS-based carpal tunnel severity score. However, the patient’s self-rated writing and holding a book dysfunctions were found to have poor predictive power in explaining the CTS-diagnosed patient’s NCS-based severe state. The remainder of the CTS dysfunctions indicators accurately explained the actual severity state of the CTS patients measured with NCS. Last but not least importantly, the patient’s overall mean BCTQ FSS had a great predictive accuracy (AUR ROC, 0.828) explaining the CTS patient’s severe state identified by NCS.
Finally, the multivariate generalized linear mixed model was used to test whether the CTS-diagnosed patients' subjective self-rated severity and dysfunction scores might not be used as an interim and comparative assessment tool to predict the patient’s severity measured with NCS. The findings (Table 6) showed that the patients’ sexes, ages, and affected extremities did not converge statistically significantly on their NCS-based severity score (p>0.050 each). The patients’ self-rated mean BCTQ SSS correlated significantly and positively with their mean NCS-based severity score (r=0.634, p<0.010), indicating that as the patients’ mean BCTQ SSS tended to rise by 1 point; their corresponding mean NCS-based severity scores tended to rise by 0.96 points on average accordingly (Fig. 1). Similarly, the patients’ BCTQ FSS converge significantly and positively on NCS-based CTS severity (r=0.447, p<0.010) (Fig. 2).
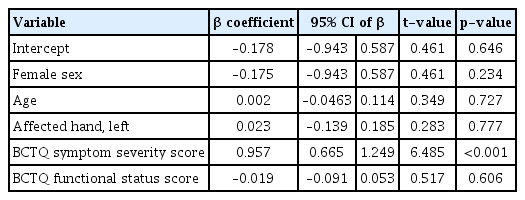
Multivariate generalized linear mixed analysis of the CTS patients’ nerve conduction severity of symptoms
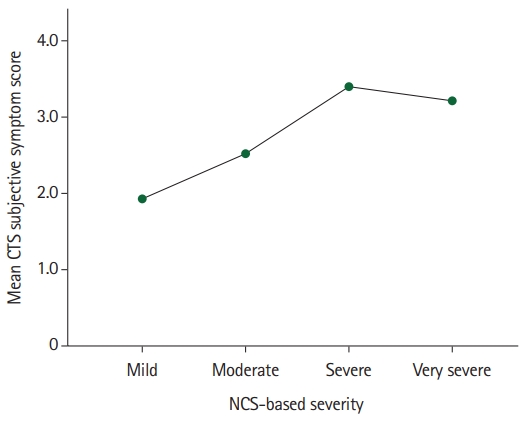
The association between nerve conduction studies (NCS)-based severity and patients’ subjective overall carpal tunnel syndrome (CTS) mean symptom score.
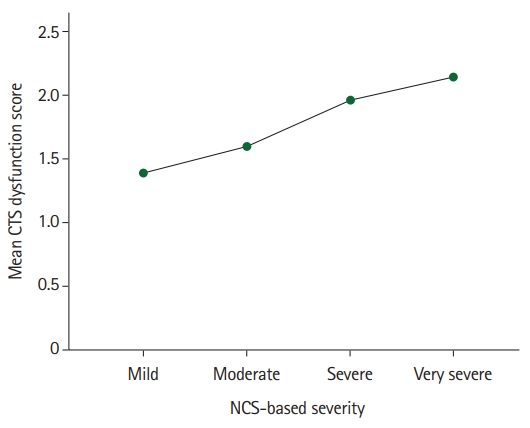
The association between nerve conduction studies (NCS)-based severity and patients’ subjective overall carpal tunnel syndrome (CTS) mean dysfunction score.
Discussion
Although many authors believe that CTS is a clinical diagnosis, others believe in NCS’s importance and contribution to confirming subjective suspicion by an objective measure. Additionally, it has an essential role in medico-legal issues. Our study tried to correlate the subjective and objective measures to demonstrate if we can predict the severity of one measure by studying the relationship between them.The analysis showed that both BCTQ elements (symptom severity scale and functional status scale) significantly correlated with NCS severity. This correlation was more significant in the symptom severity scale items rather than the functional status scale. Night and daytime hand numbness and pain showed the strongest correlation with the NCS severity. Similarly, although the FSS showed a positive correlation with NCS severity, this correlation showed that some of those indicators might suffer from inconsistency, particularly holding a book, writing, and carrying market bags.
By reviewing the literature, we found similar studies supporting our findings. Dhong et al. [11] evaluated 138 patients (222 hands) with CTS to correlate the NCS and self-administered questionnaire findings to determine the diagnostic relations. The authors concluded that the NCS data correlated more significantly and was associated more linearly with SSS than the FSS. The authors recommend accepting electrodiagnostic data as a supporting reference because patients’ main concerns are their subjective symptoms.
Similarly, Izadi et al. [12] conducted a cross-sectional study to correlate clinical grading using both the numeric pain rating scale and BCTQ, in addition to physical tests with NCS. The authors found that physical tests are not a reliable screening method for the evaluation of CTS severity. However, BCTQ is a reliable and valuable screening method for evaluating CTS severity.
Banach et al. [13] studied the correlations between the neurological examination of CTS and selected electrophysiological test parameters. They found that both sensory and motor deficits were significantly correlated with the NCS severity. Sensory findings were more notable and had a stronger correlation with electrophysiological studies. This indirectly supports our results as the sensory findings are reflected mainly by the items of symptom severity scale.
In our study, the findings were congruent with that present in the literature. Therefore, we can utilize and recommend the clinical grading based on BCTQ to predict the CTS severity on NCS.
The drawback of this study is that we applied the BCTQ to patients with NCS finding of CTS. Although NCS is a confirmatory test, 10% of patients with a clinical diagnosis of CTS have normal electrophysiological studies [14]. On the other hand, asymptomatic individuals may get abnormal results on NCS [15]. As a result of our study’s inclusion criteria, patients with clinical CTS and normal NCS were excluded from the study. Additionally, patients with abnormal NCS were included regardless of being asymptomatic. Nevertheless, patients with normal NCS results should be evaluated separately or considered a control group. Although NCS is operator-dependent, this was not a problem in our study because the same neuro-medicine doctor did NCS for all patients.
Our goal for the future is to correlate the severity of compressive neuropathy in general in clinical and electrophysiological studies. The study will be expanded to include more compressive neuropathic conditions such as cubital tunnel syndrome, tarsal tunnel syndrome, and Guyon canal syndrome.
Conclusion
The detailed analysis showed a strong correlation between the severity of the CTS clinical picture expressed by BCTQ and the severity based on nerve conduction. This correlation is more evident in SSS than in FSS. Night pain and numbness showed the strongest association of all BCTQ items with NCS. Nevertheless, we can expect nerve conduction severity based on clinical severity as measured by BCTQ; we still recommend performing NCS for patients with a clinical diagnosis of CTS as an objective confirmatory measure and for medico-legal issues, mainly when CTS features overlap with other pathologies and patients are unreliable and exaggerate their complaints for secondary gain.
Notes
The authors have nothing to disclose.
Funding
None.